How to Use a Php Profiler
Nobody aspires to write slow applications, yet there are a lot of really slow Web applications out there! Unfortunately, the performance of an application often takes a back seat during development and sluggish application performance only becomes a critical problem after it's deployed to the Web. The problem is that PHP applications always run super fast when there are just 3 records in your database and you're running on localhost � these assumptions are not valid for real world applications. This tutorial covers how to use a PHP profiler to improve application performance. You'll learn how to identify which lines of PHP code are the most time consuming, which lines of code are most frequently visited, and many other important benchmarking and optimization techniques that will help ensure that your programs run fast.
PHP Application Performance Tuning
The first step in tuning of the PHP Application's performance is finding the bottlenecks. You'll need to know:
- Which PHP scripts take the longest time to run?
- What lines of code, function calls and class methods is the application spending most of the time?
- What are the lines of code, function calls and class methods which are most frequently visited?
- How does the data above changes when you run through the application multiple times, under heavy load?
A PHP Profiler can present all of this information in easy to read, graphical form, allowing you to find and fix potential PHP application performance problem areas.
(PHP Profiler - Click to Enlarge)
How to use PhpED's PHP Profiler
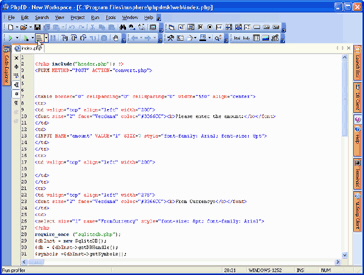
In order to follow along with this tutorial you'll need to download a PHP Profiler. We'll be using PhpED, a Windows-based integrated development environment for PHP which includes a PHP debugger and various other utilities - best of all, there's a free trial available. If you have a PHP script open in PhpED, you can start PhpED's PHP Profiler for this script by pressing Run Profiler button from PhpED's PHP debugger tool bar or by pressing ALT-F9 on the keyboard.
(Invoking the PHP code profiler - Click to Enlarge)
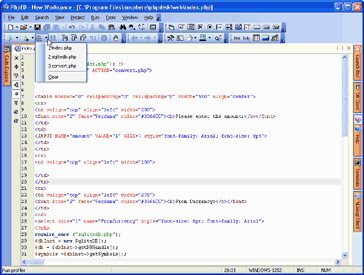
The Run PHP Profiler toolbar button also provides a drop-down menu containing a list of PHP scripts that were previously run using the PHP profiler.
(Re-running the PHP performance profiler on previously run scripts - Click to Enlarge)
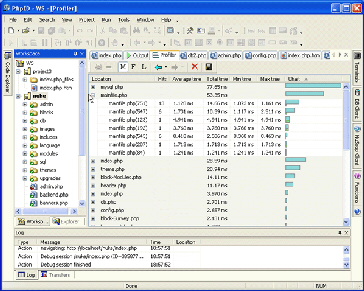
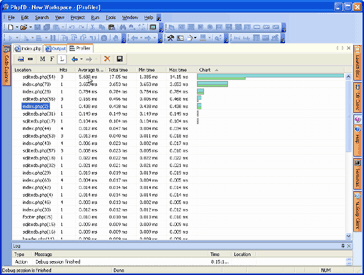
As the PhpED PHP Profiler runs, it collects important data points pertaining to the execution of the script which are graphically displayed in the PHP Profiler Window.
(Viewing PHP profiler results - Click to Enlarge)
Which PHP Scripts Run the Slowest?
The PhpEd PHP Profiler tells you which PHP scripts are the most time consuming. The profiler report displayed in the PHP Profiler output table show:
- The number of times or 'hits' that each line of code in PHP script was run
- Average execution time for each line of code in PHP script
- Total execution time of each line of code in PHP script
- Minimum time spent in each line of code in PHP script
- Maximum time spent in each line of code in PHP script
In addition to this PHP application performance data, there is a chart column, which displays a graphical presentation of relative execution time of every line of PHP code. The most time consuming line is set at 100% and the rest of the times are shown as fractions of the longest time interval. The Upper horizontal bar represents the total time and the lower bar represents time spent on each line when it is executed.
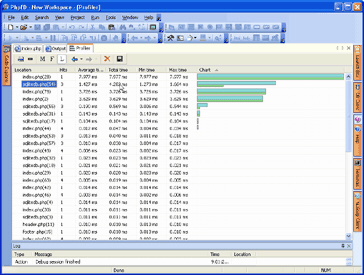
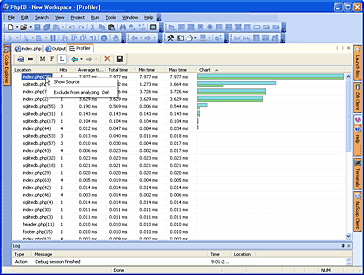
The data in each column of the PHP profiler report can be sorted, providing an easy way to view the PHP performance profile of your application from any perspective. For example, in the following illustration shows that line number 54 in the index.php script was visited 3 times, the application spent 1.4276 ms on average executing this line, the total time of the execution was 4.282 ms, minimum time spent was 1.273ms and maximum time was 1.664 ms
(Sorting the data contained in a PHP Profiler Report - Click to Enlarge)
What lines of PHP code, function calls and class methods does the application spend most of the time?
The PhpEd PHP Profiler lets you jump to the location in PHP code directly from the PHP profiler output table. Just double click on the entry in the location column or select the Show Source item from the short-cut menu and PhpED will display the corresponding line of PHP code in the PHP editor. For example, in the illustration below you can see that the line of code which took the longest time to execute according to the Profiler output, is line number 28 in index.php, which took up a total execution time of 7.977 milliseconds.
(Jumping to the PHP source code from the PHP Profiler - Click to Enlarge)
Now when you double-click the index.php entry in the Location column, PhpED will open the index.php in the PHP editor and highlight line #28, as illustrated here:
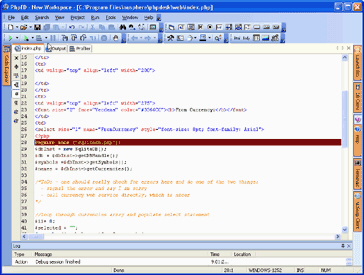
(Tracing back from a PHP profiler report to the underlying profiled line of PHP Code - Click to Enlarge)
What lines of PHP code, function calls and class methods are most frequently visited?
The PhpEd PHP Profiler displays the number of times each line of PHP code was visited throughout program execution. As with any other column in PHP Profiler output window, you can sort the entries in Hit column in ascending or descending order. For example, you can sort the entries in Hit column to see which line of code was hit the highest number of times. You can display hits corresponding to each function and methods using the PHP Profiler, as illustrated here:

(Using a PHP Profiler to determine the most frequently visited lines of PHP Code - Click to Enlarge)
How does the PHP Profiler data change when you run through the application multiple times
The PhpED PHP debugger will let you see the results produced by the Profiler in the previous runs of the application. You can navigate to different snapshots of PHP Profiler runs using left and right arrow buttons on Profiler's tool bar.

(Viewing PHP profiles of previous runs - Click to Enlarge)
The buttons also display the dropdown with previously generated results and their timestamps:

(Viewing timestamps of previous runs of the PHP Profiler - Click to Enlarge)
PHP Profilers in a Nutshell
In this tutorial you learned how to use a PHP Profiler to generate a report containing the key application performance benchmarks which enable you to quickly find and eliminate the potential bottlenecks in your PHP scripts. A PHP profiler is a must-have tool for serious PHP application developers because it's the only tool that will provides you with a sense for how fast or slow your application will run. Readers can get started by downloading a trial of the PhpED PHP Profiler.